The S&P 500: What’s Moving the Needle Before the Market Opens?
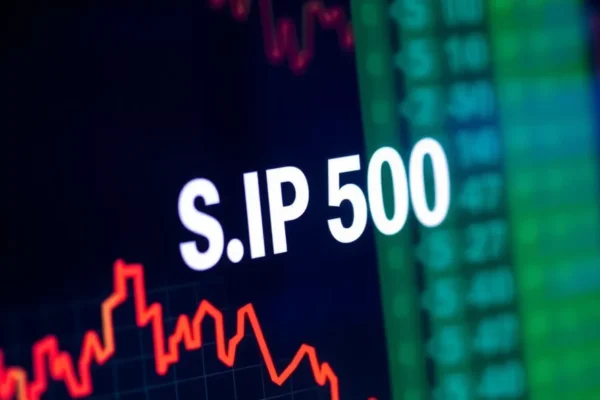
Every morning, before the big bell rings on Wall Street, a buzz goes through the trading world. Investors, analysts, and pretty much anyone interested in the stock market are watching the S&P 500 pre-market indicators. These early signals give us a hint about whether the market is likely to open higher or lower. It’s like checking the weather report before heading out, but for the financial markets.
So, what exactly are these pre-market indicators? Think of them as the early bird reports. Stock futures, which are agreements to buy or sell a stock at a future date at a predetermined price, are a big part of this. If these futures are climbing, it suggests optimism and that the S&P 500 might open on a positive note. Conversely, if they’re sliding, it points towards caution or even some worry among traders, potentially leading to a lower market open.
But it’s not just about futures. We also look at global markets. What’s happening in Europe or Asia can often set the tone for U.S. trading sessions. Plus, any major economic data released overnight or just before the U.S. market open can significantly sway investor sentiment. Companies also sometimes drop big news after hours or early in the morning, and how the market reacts to that news is closely watched.
Why the Buzz Around Today’s S&P 500 Open?
The reason people are so keen to know the S&P 500’s opening direction today, and most days really, boils down to one simple thing: momentum. The stock market has a tendency to keep moving in the direction it’s already going, at least for a while. So, a higher open often suggests the positive momentum from the previous day or overnight might continue, leading to further gains. On the flip side, a lower open can signal that any upward trend might be fading, or that a correction could be on the horizon.
This is crucial for traders trying to make quick decisions. For businesses, it can influence investment plans and overall confidence. For individuals with investments, understanding these early signals can help them make more informed choices about their portfolios. It’s all about trying to get ahead of the curve and understand the prevailing market trends.
Think about it like this: if you see a lot of people rushing into a particular store, you might assume there’s a great sale happening, and you might be more inclined to join them. The pre-market indicators act in a similar way for the stock market, showing which way the early crowd is heading.
A Look Back: How We Got Here
To truly grasp what’s happening with the S&P 500 today, it helps to understand a bit about its history and how the market works. The S&P 500, a collection of 500 of the largest U.S. companies, is often seen as a benchmark for the overall health of the U.S. stock market. When the S&P 500 is doing well, it generally means those big companies are performing well, which is often a sign of a healthy economy.
For decades, the stock market has experienced cycles of growth and decline. There are periods of bullish runs, where optimism fuels rising prices, and periods of bearish trends, where fear and uncertainty lead to falling prices. Investor sentiment plays a massive role in these cycles. Positive sentiment can drive demand for stocks, pushing prices up, while negative sentiment can lead to selling, driving prices down.
Recent economic data, interest rate decisions by central banks, geopolitical events, and company-specific news all contribute to this sentiment. For example, strong job reports can signal a robust economy, leading to positive investor sentiment. Conversely, rising inflation can cause concern, leading to a more cautious outlook. All these factors build up and influence the trading decisions made before and during the regular market open.
What This Means for You and the Broader Market
The S&P 500 opening higher or lower today isn’t just abstract financial news; it has real-world implications. For individual investors, a positive opening can mean their portfolios are starting the day with a bit more value. It can offer a psychological boost and reinforce confidence in their investment strategies. Conversely, a negative opening might lead to some anxiety, prompting a review of existing holdings or a pause before making new investments.
For businesses, the stock market’s performance is a key indicator of economic health and consumer confidence. A consistently higher opening and upward trend in the S&P 500 can encourage companies to expand, hire more people, and invest in new technologies. This can lead to job creation and economic growth, benefiting everyone. On the other hand, a sustained downward trend can signal economic headwinds, leading businesses to become more conservative with their spending and hiring.
Technology companies, in particular, are often closely watched. Their stock prices can be sensitive to changes in investor sentiment and the overall economic climate. A bullish market often means more capital is available for investment in innovation and research, which can accelerate technological advancements. A more cautious market might see a slowdown in funding for newer, riskier tech ventures.
Essentially, the opening direction of the S&P 500 acts as an early gauge of market trends and investor appetite for risk on any given day. It helps set the mood for the entire trading session and can influence broader economic activity.
Peering Ahead: What Could Tomorrow Bring?
Predicting the exact movement of the stock market is a complex art, but by looking at the pre-market indicators and understanding the underlying drivers, we can make some educated guesses about future market trends. If the S&P 500 opens higher today and this positive momentum continues, supported by good economic news or strong corporate earnings, we might see a continued upward trajectory. This could mean further gains in the coming days and weeks, potentially boosting investor confidence and encouraging more investment.
Conversely, if the pre-market indicators suggest a weaker opening, and this is followed by negative economic data or concerning global events, the market could see a period of consolidation or even decline. This doesn’t necessarily mean a crash is imminent, but it could signal a shift towards a more cautious investment environment. In such scenarios, investors might focus more on defensive stocks or look for opportunities in sectors less sensitive to economic downturns.
The key takeaway is that the market is dynamic. Today’s pre-market indicators are just one piece of a much larger puzzle. Future movements will depend on a continuous stream of new information, from inflation reports and central bank policies to geopolitical developments and technological breakthroughs. Staying informed about these factors is crucial for anyone trying to navigate the ever-changing landscape of the stock market.
Frequently Asked Questions About the S&P 500
What does pre-market trading mean for the S&P 500?
Pre-market trading happens before the official market open. The S&P 500 pre-market activity, through stock futures and other indicators, gives early clues about investor sentiment and potential price movements for the S&P 500 when trading begins.
How does economic data influence the S&P 500 opening?
Economic data releases, such as inflation rates or employment figures, are closely watched. Positive data often boosts investor confidence, leading to expectations of a higher S&P 500 opening, while negative data can cause concern and a potential lower opening for the S&P 500.
Can investor sentiment alone move the S&P 500?
Yes, investor sentiment plays a significant role. A widespread feeling of optimism or pessimism about the S&P 500 and the economy can drive buying or selling activity, directly impacting the S&P 500’s opening price and overall market trends.
What are stock futures and how do they relate to the S&P 500?
Stock futures are contracts for buying or selling an asset at a specific price on a future date. S&P 500 futures are a popular tool for traders to speculate on the future direction of the S&P 500, and their movements are key pre-market indicators.
What are the most important market trends to watch for the S&P 500?
Key market trends for the S&P 500 include overall economic growth, interest rate policies, inflation levels, corporate earnings reports, geopolitical stability, and technological innovation. Watching these factors helps understand the broader market trends impacting the S&P 500.