Gift Nifty 50 Faces Crucial Test at Key Support Levels
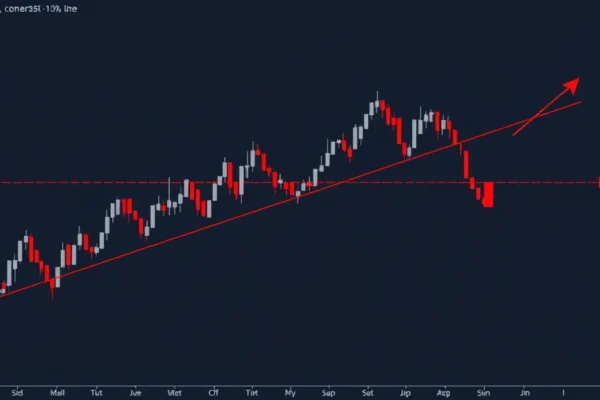
The Gift Nifty 50, a trading derivative mirroring the performance of India’s Nifty 50 index, is currently navigating a critical juncture. Recent price action has formed what technical analysts describe as a bearish triangle pattern, a chart formation that often signals a potential downward price movement. This pattern, coupled with the significant psychological and technical support at the 24,123 level for the Gift Nifty 50, presents a pivotal moment for traders and investors closely monitoring the Indian stock market. Understanding these levels and the underlying market sentiment is crucial for anyone involved in trading or investing in these financial markets.
The Developing Bearish Triangle Pattern
A bearish triangle pattern, specifically a descending triangle, is identified on a price chart by a descending trend line connecting lower highs and a horizontal trend line at the bottom, representing a support level. In the context of the Gift Nifty 50, this pattern suggests that while buyers are stepping in at a particular price level (the support), sellers are becoming more aggressive, pushing prices down from higher points. This tightening range can indicate building pressure that, if the support breaks, could lead to a significant price decline. This technical formation is a common tool used in technical analysis to predict potential future price movements based on historical trading data.
Strategic Rationale Behind Market Moves
The formation of a bearish triangle pattern on the Gift Nifty 50 is not a strategic decision by a single company but rather a reflection of collective market sentiment and trading behavior. It arises from the interplay of supply and demand dynamics influenced by a multitude of factors. These can include macroeconomic news, corporate earnings reports, geopolitical events, and overall investor confidence. For traders, recognizing this pattern is an attempt to anticipate the “why” behind price movements. The horizontal support at 24,123 signifies a level where, historically, buying interest has been strong enough to halt price declines. The bearish triangle suggests this buying interest might be waning, or that selling pressure is intensifying, forcing traders to re-evaluate their positions.
Competitive Context in Global Financial Markets
The Gift Nifty 50 operates within a highly competitive global financial markets landscape. Its performance is an indicator of sentiment towards emerging markets, particularly India. While not a direct competitor in the traditional sense, other emerging market indices and even developed market benchmarks can influence investor capital flows. If the Gift Nifty 50 shows sustained weakness due to the bearish triangle and a breach of support, it could lead investors to seek opportunities elsewhere, potentially benefiting other emerging markets or safer, developed market assets. Traders and institutional investors constantly compare the risk-reward profiles across various markets, and technical signals like these play a significant role in that assessment.
Industry Implications for the Stock Market
The technical pattern observed in the Gift Nifty 50 has broader implications for the stock market, especially for investors interested in Indian equities. A break below the 24,123 support level could trigger a wave of selling as stop-loss orders are executed, potentially leading to a cascading effect. This could signal a broader market downturn or a correction in Indian equities, affecting not just the large-cap stocks represented in the Nifty 50 but potentially trickling down to mid- and small-cap segments. This is a key indicator that financial analysts watch to gauge overall market health and investor sentiment.
Financial and Operational Impact
For traders and investors, the immediate financial impact of the bearish triangle and the 24,123 support level is centered on potential trading outcomes. A confirmed breakdown below support could lead to losses for those holding long positions (bets on rising prices) and opportunities for those taking short positions (bets on falling prices). The “live trading levels” are crucial here. If the market sentiment shifts, and the 24,123 support fails, traders might quickly adjust their portfolios, leading to rapid price movements. For financial institutions that facilitate trading, increased volatility can lead to higher trading volumes and potential revenue increases, but also heightened risk management challenges.
Execution Risks and Challenges
The primary risk with technical analysis, including the bearish triangle pattern, is that it is not a perfect predictor of future price movements. Market sentiment can shift rapidly due to unforeseen news or events, rendering technical patterns obsolete. For the Gift Nifty 50, the 24,123 support level might hold despite the pattern, especially if positive economic data or corporate announcements emerge. The challenge for traders is to differentiate between a temporary pause in selling and a genuine reversal. Historical precedents show that even strong support levels can be breached. The “execution risk” for traders lies in making decisions based on incomplete information or misinterpreting the signals.
Stakeholder Implications
The implications of the Gift Nifty 50’s price action extend to various stakeholders. For retail investors, a sustained bearish trend could lead to portfolio depreciation, impacting their financial goals. Institutional investors and fund managers will be closely watching, potentially rebalancing their portfolios to mitigate risk or seek opportunities in other markets. Employees working in financial services firms may experience increased workload due to heightened trading activity and risk management requirements. Customers of financial services might see changes in the investment products and advisory services offered, reflecting the prevailing market sentiment.
Outlook and Next Steps
The outlook for the Gift Nifty 50 hinges on its ability to hold the 24,123 support level and the subsequent price action. If the bearish triangle pattern plays out and the support breaks decisively, traders will look for further downside targets, potentially revisiting lower levels. Conversely, a strong bounce from 24,123, accompanied by a reversal pattern, could invalidate the bearish triangle and signal a potential uptrend. Key milestones to watch include the volume of trading on any break of support, the speed of price movement, and any accompanying fundamental news that could sway market sentiment. Measurable outcomes could be seen within days to weeks, depending on the pace of market reaction.
Key Questions and Answers
What does the bearish triangle pattern on the Gift Nifty 50 signify?
A bearish triangle pattern on the Gift Nifty 50 suggests that selling pressure is increasing, potentially leading to a downward price movement if the support level is broken. This is a common observation in technical analysis of financial markets.
Why is the 24,123 support level so important for the Gift Nifty 50?
The 24,123 level is considered a significant support level for the Gift Nifty 50 because it represents a price point where buying interest has historically been strong enough to prevent further declines, indicating key support levels for traders.
How does this technical analysis impact live trading for the Gift Nifty 50?
In live trading, the bearish triangle and the 24,123 support level alert traders to a potential for a price drop. Traders might adjust their strategies, entering short positions or exiting long positions if the support breaks, influencing immediate market sentiment and stock market activity.
What are the potential risks for traders if the 24,123 support level fails for the Nifty 50 Index?
If the 24,123 support level fails for the Nifty 50 Index, traders holding long positions could face significant losses, while those who have shorted the index could profit. This can also trigger further selling as stop-loss orders are activated, exacerbating price declines.
Is the bearish triangle pattern a guaranteed indicator of a price drop for the Gift Nifty 50?
No, a bearish triangle pattern is not a guaranteed indicator. Market sentiment can change rapidly, and unexpected positive news could cause the Gift Nifty 50 to rebound, invalidating the bearish signal. Technical analysis is a tool, not a certainty, in investing.
What should investors watch for to confirm a bearish trend in the Gift Nifty 50?
Investors should watch for a decisive break below the 24,123 support level on increased trading volume, followed by sustained downward price action. They should also monitor macroeconomic news and corporate earnings that could influence the broader market sentiment for the Nifty 50 Index.
This analysis is for informational purposes only and does not constitute financial advice. Business outcomes are subject to execution risk.