Reading the Story of the Markets
Imagine you are walking into a busy coffee shop. You see some people drinking quickly, some are chatting loudly, and others are sitting quietly with a book. Even without hearing a single word, you can probably guess the mood of the room. You are reading the patterns of behavior. In the world of finance, technical analysis works in a very similar way. It is the practice of looking at historical price movements to try and understand what might happen next in the market.
Instead of looking at a company’s profits or their new products, technical analysis focuses on the actual movement of prices. It assumes that everything that can be known about a company is already reflected in its price. By studying stock charts, you are essentially looking for footprints left behind by other buyers and sellers. These footprints form patterns that tend to repeat over time because human psychology does not change very quickly. When people get excited, they buy, and prices go up. When people get scared, they sell, and prices go down. Technical analysis helps you identify these emotional shifts through visual data.
Why Everyone is Turning to Charts Today
You might have noticed that more people than ever are talking about trading and market trends. We are living in an era where the financial markets are more accessible than they have ever been. In the past, you needed a massive amount of money and a direct line to a professional broker to participate. Today, anyone with a smartphone can access real time data and sophisticated tools.
This shift has created a huge wave of interest in investment basics. People are looking for ways to take control of their own financial futures, and they want more than just a basic savings account. They want to understand the ebb and flow of the market. Because the digital age provides instant access to information, there is a growing desire to learn how to interpret that information. This is why so many beginners are searching for ways to understand how to read a chart and what those moving lines actually represent. It is not just about speculation; it is about gaining a sense of direction in a very fast moving world.
A Brief History of Pattern Recognition
The idea of looking at charts is not a new trend. Long before we had high speed internet and sleek mobile apps, traders were drawing lines on paper to track the movement of commodities like wheat, gold, and tea. One of the most famous foundations of this practice comes from a man named Charles Dow. He developed what became known as Dow Theory, which suggested that market trends could be identified by looking at how prices moved over time.
Back then, technical analysis was a slow and manual process. Traders had to physically plot points on paper. As technology evolved, so did the methods. We moved from hand drawn sketches to computerized systems that could calculate complex math in a fraction of a second. This evolution has turned what used to be a niche hobby for mathematicians into a mainstream way to view the global economy. The core concept remains the same, though. Whether it is a hand drawn line from 1900 or a digital indicator from 2024, the goal is to find order in the chaos of the market.
The Essential Toolkit for New Traders
If you are just starting out, looking at a professional trading screen can feel like staring at a cockpit of a jet. There are lines, colors, and numbers everywhere. To make sense of it, you need to focus on a few core concepts that form the foundation of most trading strategies.
Understanding Candlestick Patterns
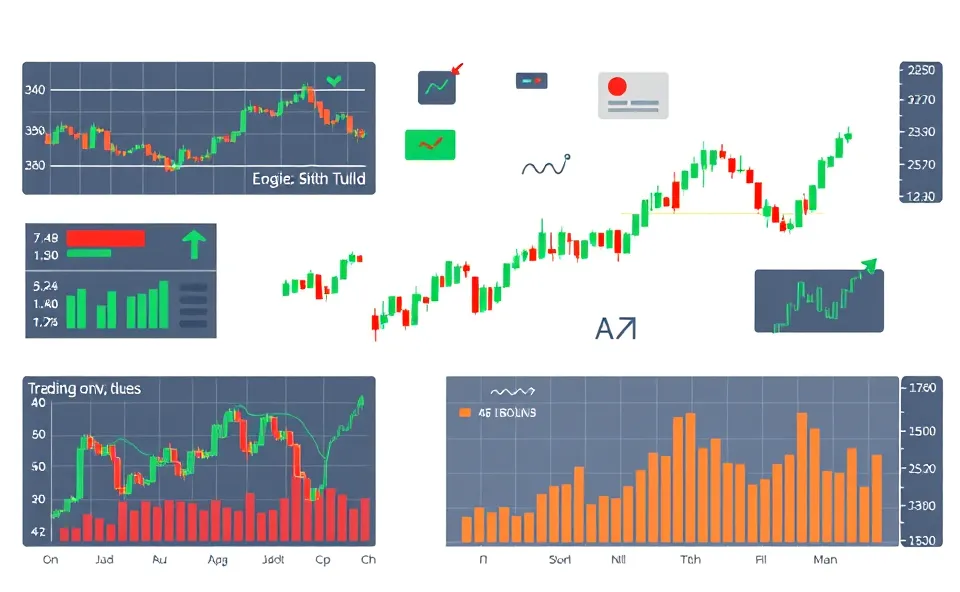
Most modern stock charts do not just use simple lines. Instead, they use something called candlestick patterns. Each candle tells a tiny story about what happened during a specific period, such as a minute, an hour, or a day. A single candle shows you four key pieces of information: the opening price, the closing price, the highest price reached, and the lowest price reached during that time.
- The Body: This is the thick part of the candle. It shows the range between the opening and closing prices.
- The Wicks: These are the thin lines sticking out of the top and bottom. They show how high and how low the price traveled before settling.
By looking at the shape of these candles, you can see if buyers were in control or if sellers were pushing the price down. A long wick on top might suggest that buyers tried to push the price up but failed, leaving a sign of weakness.
Support and Resistance Zones
One of the most important concepts in technical analysis is the idea of support and resistance. Think of support as a floor and resistance as a ceiling. Support is a price level where a downtrend tends to pause because buyers step in to stop the price from falling further. Resistance is the opposite. It is a level where the price struggles to rise above because sellers are waiting to jump in.
When a price breaks through a ceiling, that old resistance level often becomes the new floor. Learning to identify these zones is a key part of understanding how prices move through different stages of growth or decline.
Using Moving Averages
Markets are noisy. Prices bounce up and down constantly, which can make it hard to see the actual trend. This is where moving averages come in. A moving average smooths out the price data by creating a single flowing line that represents the average price over a set number of days. If the price is consistently above its moving average, the trend is generally considered to be upward. It helps you ignore the tiny, meaningless zig zags and focus on the bigger picture.
Momentum Indicators: RSI and MACD
To add more depth to your analysis, traders often use trading indicators. These are mathematical calculations applied to price and volume. Two of the most popular are RSI and MACD.
- RSI (Relative Strength Index): This tool helps you see if an asset is being overbought or oversold. It usually moves on a scale from 0 to 100. If the RSI is very high, it might mean the price has gone up too fast and could be due for a pullback. If it is very low, the price might be due for a bounce.
- MACD (Moving Average Convergence Divergence): This indicator helps you understand the relationship between two different moving averages. It is great for identifying changes in momentum and seeing when a new trend might be starting.
What the Future of Market Analysis Looks Like
As we move forward, the way we perform technical analysis is changing again. We are entering an era where artificial intelligence and machine learning are becoming part of the equation. While humans will always be part of the process, computers can now scan thousands of charts every second, looking for the exact candlestick patterns or support resistance levels we discussed earlier.
This does not mean that the human element will disappear. In fact, it might become more important. As more people and bots use the same mathematical indicators, the market may react even more quickly to certain signals. The future will likely be a blend of human intuition and machine precision. For beginners, this means the most valuable skill will not just be knowing how to read a chart, but knowing how to use these high tech tools to gain a unique perspective on the market.
Frequently Asked Questions
What is the main goal of technical analysis for beginners?
The primary goal is to use historical data and stock charts to identify patterns. These patterns help traders make more informed decisions about the direction the market might move in the future.
Can trading indicators predict the future with certainty?
No. It is important to remember that no tool, including RSI or MACD, can predict the future with 100 percent certainty. They are tools used to calculate probabilities and identify trends, not magic crystal balls.
Is technical analysis better than looking at company earnings?
They are different approaches. Looking at earnings is called fundamental analysis, while looking at charts is technical analysis. Many people use both together to get a complete view of the financial markets.
How do I start learning candlestick patterns?
The best way to start is by observing real time charts. Look for common shapes and see how the price reacts when it hits a level of support resistance. Practice seeing the patterns before you ever make a decision.
Do I need expensive software to perform technical analysis?
Not at all. Most modern platforms offer free access to basic stock charts and common tools like moving averages. You can learn the basics using almost any standard financial website or app.