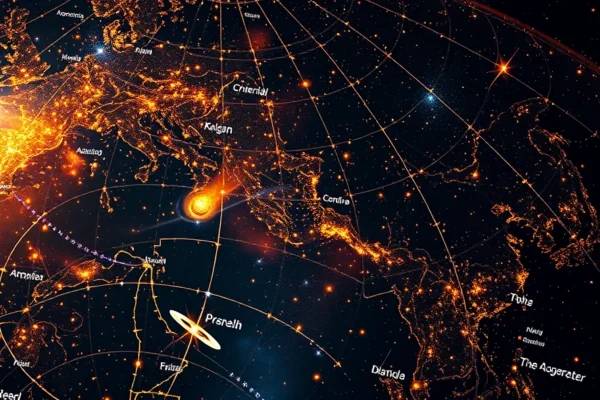
A Universe in Your Hands The New 5.6 Trillion Pixel Interactive Space Map
Imagine holding a map so vast it contains 75% of the observable sky, detailed with an unprecedented four billion celestial objects. This isn’t science fiction; it’s the reality of a groundbreaking new interactive space map, a colossal digital representation of our universe that promises to revolutionize how we study and appreciate the cosmos. Developed by a collaboration of leading astronomical institutions, this largest space map ever created invites everyone to explore the universe in stunning detail. It’s more than just a static image; it’s a dynamic gateway for cosmic exploration, built on an immense amount of astronomy data.
This ambitious project aims to democratize access to the wonders of space, transforming complex astronomical information into an engaging and accessible experience. It solves the long-standing problem of visualizing and interacting with the sheer scale of cosmic data, making the universe understandable and explorable for both seasoned astronomers and curious newcomers. The recent unveiling marks a significant leap forward in galaxy mapping and universe visualization, offering a digital twin of the heavens unlike anything seen before.
The development behind this remarkable achievement comes from a consortium including the National Science Foundation’s Vera C. Rubin Observatory and contributions from numerous international research teams. Their combined efforts in data collection, processing, and visualization have culminated in this extraordinary digital atlas.
Unpacking the Technology Behind the Cosmic Canvas
At its core, this interactive space map is a sophisticated assembly of data from various sky surveys, stitched together to create a seamless, high-resolution depiction of the night sky. The sheer scale, a 5.6 trillion pixel map, means that each tiny point in the image represents a significant discovery or a point of interest. Think of it like zooming into a photograph of Earth – you start with a view of continents, then zoom further to see cities, then individual buildings, and finally, even people. This cosmic map allows for a similar level of granular detail, revealing everything from distant galaxies to nebulae and individual stars.
The “interactive” element is powered by advanced web technologies and powerful data rendering engines. Instead of just looking at a flat image, users can navigate through the sky in three dimensions, zoom in on specific regions, and access detailed information about billions of celestial objects. This is made possible by cataloging and linking each object in the map to a vast database containing its properties, such as its distance, brightness, composition, and even its motion through space. The system cleverly handles massive datasets by only loading the detail required for the user’s current view, much like how a streaming service buffers only the portion of a movie you’re currently watching. This ensures a smooth and responsive experience, even when traversing billions of data points.
Exploring the Universe Today Real-World Applications and Access
The immediate application for this interactive space map lies within the scientific community. Astronomers can now use this tool as a powerful research aid, quickly identifying patterns, finding new objects of interest, and collaborating on studies with unprecedented ease. It serves as a comprehensive digital sky atlas, allowing researchers to cross-reference observations from different telescopes and surveys on a single platform.
Beyond professional astronomy, the map is designed for educational purposes. Schools and universities can use it to teach students about astronomy, making abstract concepts tangible and engaging. Public outreach is another significant area; museums, planetariums, and amateur astronomy clubs can leverage this tool to offer immersive experiences to the public, inspiring the next generation of scientists.
Currently, aspects of this technology are being piloted and integrated into existing astronomical databases and visualization platforms. While a single, unified public interface might still be evolving, the underlying data and visualization techniques are already being deployed. Users can expect to see these advancements reflected in updated versions of popular astronomy software and online resources in the near future. The Vera C. Rubin Observatory’s data, a significant component, is slated for full operation in the coming years, which will further enrich and expand this universe visualization.
Who’s Charting the Cosmos The Competitive Landscape
While this new interactive space map represents a significant leap, it builds upon decades of work in astronomical surveys and data visualization. Other large-scale sky mapping projects, such as the Sloan Digital Sky Survey (SDSS) and the European Space Agency’s Gaia mission, have provided crucial datasets and paved the way for this comprehensive atlas. These projects have also developed their own sophisticated visualization tools for researchers.
What differentiates this new map is its sheer scale and interactive depth, aiming to combine data from multiple surveys into a singular, user-friendly interface. Competitors often focus on specific aspects of the sky or types of celestial objects. For instance, Gaia excels at mapping the precise positions and movements of stars in our galaxy, while SDSS provides detailed spectroscopic data for millions of galaxies and quasars. This new initiative’s advantage lies in its ambition to integrate and visualize such diverse datasets on an unprecedented pixel count, making it a truly all-encompassing cosmic map. Companies involved in virtual reality and augmented reality are also exploring ways to integrate such data, offering potential future avenues for even more immersive cosmic exploration.
Reshaping Our Understanding The Implications of Cosmic Mapping
The implications of such a comprehensive interactive space map are profound and far-reaching. For science, it accelerates discovery. Identifying subtle patterns or anomalies in the universe becomes more efficient, potentially leading to new theories about dark matter, dark energy, and the evolution of galaxies. It democratizes access to the cosmos, empowering citizen scientists to contribute to research by identifying novel phenomena.
Economically, the development and maintenance of such large-scale data projects stimulate the tech industry, creating demand for data scientists, software engineers, and visualization specialists. Educational institutions and the burgeoning space tourism sector could also benefit from enhanced visualization tools. Socially, it fosters a deeper appreciation for our place in the universe, promoting a sense of wonder and curiosity about space exploration. This is not just a tool for scientists; it’s a window for humanity to better understand its cosmic home. The short-term impact will be felt in research and education, while the long-term impact could influence public perception and engagement with science for generations.
Navigating the Stars The Challenges Ahead
Despite its incredible capabilities, this interactive space map faces significant challenges. The sheer volume of data is immense, requiring substantial computational power for processing, storage, and real-time rendering. Maintaining the accuracy and updating the map as new data becomes available is an ongoing logistical hurdle. Ensuring equitable access to this resource, particularly for those with limited bandwidth or older computing hardware, is another consideration.
Furthermore, translating the raw data into scientifically meaningful insights still requires expert human interpretation. While the map can reveal correlations, understanding the underlying physics and astronomical processes demands continued scientific investigation. Ensuring data security and intellectual property rights related to the vast amount of collected information also presents complexities. The current iteration, while powerful, represents a snapshot in time, and the dynamic nature of the universe means constant refinement will be necessary.
The Future of Cosmic Exploration What’s Next
The trajectory of this interactive space map points towards even greater integration and interactivity. Future developments will likely include real-time data feeds from ongoing sky surveys, allowing users to observe celestial events as they happen. Enhanced artificial intelligence algorithms will be integrated to automatically detect and classify new objects and phenomena, making the map an active discovery engine.
We can also anticipate deeper integration with virtual and augmented reality technologies, offering truly immersive experiences where users can “walk” through nebulae or “visit” distant galaxies. The ongoing expansion of observatories like the Vera C. Rubin Observatory will continue to feed this map with richer, more detailed information, pushing the boundaries of our observable universe. The ultimate goal is to create a living, evolving digital representation of the cosmos that constantly expands our knowledge and inspires our imagination.
Frequently Asked Questions About This Cosmic Map
What is the main benefit of this interactive space map?
The primary benefit is unprecedented access and detail for exploring the universe. This interactive space map makes billions of celestial objects and vast amounts of astronomy data understandable and explorable for both scientists and the public, enabling new avenues for cosmic exploration.
How can an ordinary person explore the universe with this map?
As the technology matures and interfaces become widely available, anyone with an internet connection can use this cosmic map to zoom into detailed views of galaxies, nebulae, and star clusters, accessing information about each object and learning about our place in the cosmos.
Is this the largest space map ever created?
Yes, with its 5.6 trillion pixel map resolution covering 75% of the sky and detailing 4 billion objects, it is currently the largest space map by sheer data volume and visual fidelity.
What are some potential applications beyond astronomy research?
Beyond research, it offers significant potential for education, public outreach, and even industries like virtual reality and gaming that seek to create realistic universe visualization experiences.
When will this technology be fully accessible to the public?
While components are being integrated now, a fully unified and widely accessible public platform is expected to roll out in phases over the next few years, coinciding with the full operational status of key observatories like the Vera C. Rubin Observatory.
This article discusses a developing technology based on ongoing research and planned implementations. Specific timelines and accessibility may vary, and ongoing advancements will continue to refine its capabilities.